
Drupal Public Data, Statistics & Silver Linings? An Exploration #2


This is part 2 of a 5-part series examining Drupal public data in search of actionable insights
Preamble
In Part 1 of this article, we presented, examined and applied a number of statistical transformations to Drupal installations data as reported by the Drupal Project. Part 2 introduces a small number of models drawn from statistics and mathematics intended to engender an increased understanding of not only how Drupal installation came to be this way, but also why they are this way.
Building Up a Statistics Vocabulary: Model(s)
The "S-Curve" Model
Software is a type of innovation. The ideal innovation pattern (at least from the point of producers) is a series of successively popular Product releases that are wholly and completely taken up by the target audience. In an ideal world, the release of a new Product kicks off an immediate and total transference of any historically developed audiences that developed around older iterations of the Product to the newest iteration of the Product. This enables the whole enterprise to grow on itself and attain ever greater heights. A really nice discussion of this phenomena appears on Medium in Renata Ashkenazi's 2022 article "Technology's Favorite Curve: The S-Curve (and Why It Matters)", which comes with the following highly instructive visual aid:
Figure 2: S-Curve Model (Ideal Innovation Adoption Pattern)
")
It is clear to see why the S-Curve Model is a dream come true for producers, with every wave of innovation absorbing and building on prior waves. Commercially speaking, there is also an implicit transfer of economic value from consumer to producer with every wave. If suitable cost controls are in place, the producer is well-placed to attain (or maintain) financial sustainability.
Is the S-Curve Model Observable in Real Life?
No and yes. As is often the case when moving from abstract concept to practical reality, actual real-life situations rarely conform perfectly to the pretty models that researchers and theorists love. So no - the perfect symmetry we see in the S-Curve Model has never been observed in real life. But, equally speaking, we must say yes - the potential of this model as a deeply meaningful truth with a real impact on how innovation-oriented enterprises have chosen to engage with reality. These enterprises somehow know in their bones that if they are not growing, they are dying. This is the essential truth of the S-Curve Model. It’s just that real life is a lot messier than these simple models.
Knowing that the S-Curve Model reflects in some way the survival instincts of innovation-oriented enterprises, it is not surprising that these kinds of organizations do everything they can to encourage their audience to adopt the latest innovation in favor of past innovations. Drupal is unlikely to be an exception. We can assume this with a high degree of confidence because of what we can see before us in reality. Drupal is innovation-oriented by dint of the industry segment it competes within (high technology). High technology companies overwhelmingly exhibit an S-Curve Model orientation. In order to survive, Drupal must also engage in this behavior or risk being obliterated by those who do. We can also look to Drpual’s public statements, especially those regarding the End of Life (EOL) of historical versions of its software, which are usually accompanied with encouragements to “upgrade” to more a more modern version of Drupal in order to help support this assumption.
EDA #3: Drupal Innovation Adoption, Ideal vs. Actual
According to the article by Ms. Ashkenazi, we can fairly confidently say that in an “ideal” world, Drupal installations should look like this: Every counted Drupal installation (~700,000) being currently deployed on Drupal 11.x:
Figure 4: Drupal Installations by Edition (Ideal)

Figure 3: Drupal Installations by Edition (Actual)
In reality, as of the end of 2024, Drupal 11.x numbered less than 20,000 installations:
")
Unsurprisingly, life is not ideal. It’s messy and a significant number of Drupal installations appear to be “stuck” at Drupal 7.x.
What might help to explain this situation?
The "Diffusion of Innovation" Model
In innovation circles, one of the most famous attempts to forge the raw power of statistical theory into a practical, usable tool was introduced in 1962 in a book titled Diffusion of Innovations by Everett Rogers. This incredibly influential work discussed the "Innovation-Adoption Curve", which was how Rogers chose to harness and apply statistical theory to the dynamics of innovation.
In his book, Rogers adapted one of the fundamental models of statistics to help make sense of how people engaged with innovation. The discriminator he chose was simple but powerful: Time. Rogers measured, relatively speaking, how long it took people to adopt an innovation and then placed them into categories that went from “relatively fast” to “relatively slow”.
Here are the categories that Rogers identified:
- Innovators
- Early Adopters
- Early Majority
- Late Majority
- Laggards
Figure 5: Rogers' Innovation-Adoption Curve
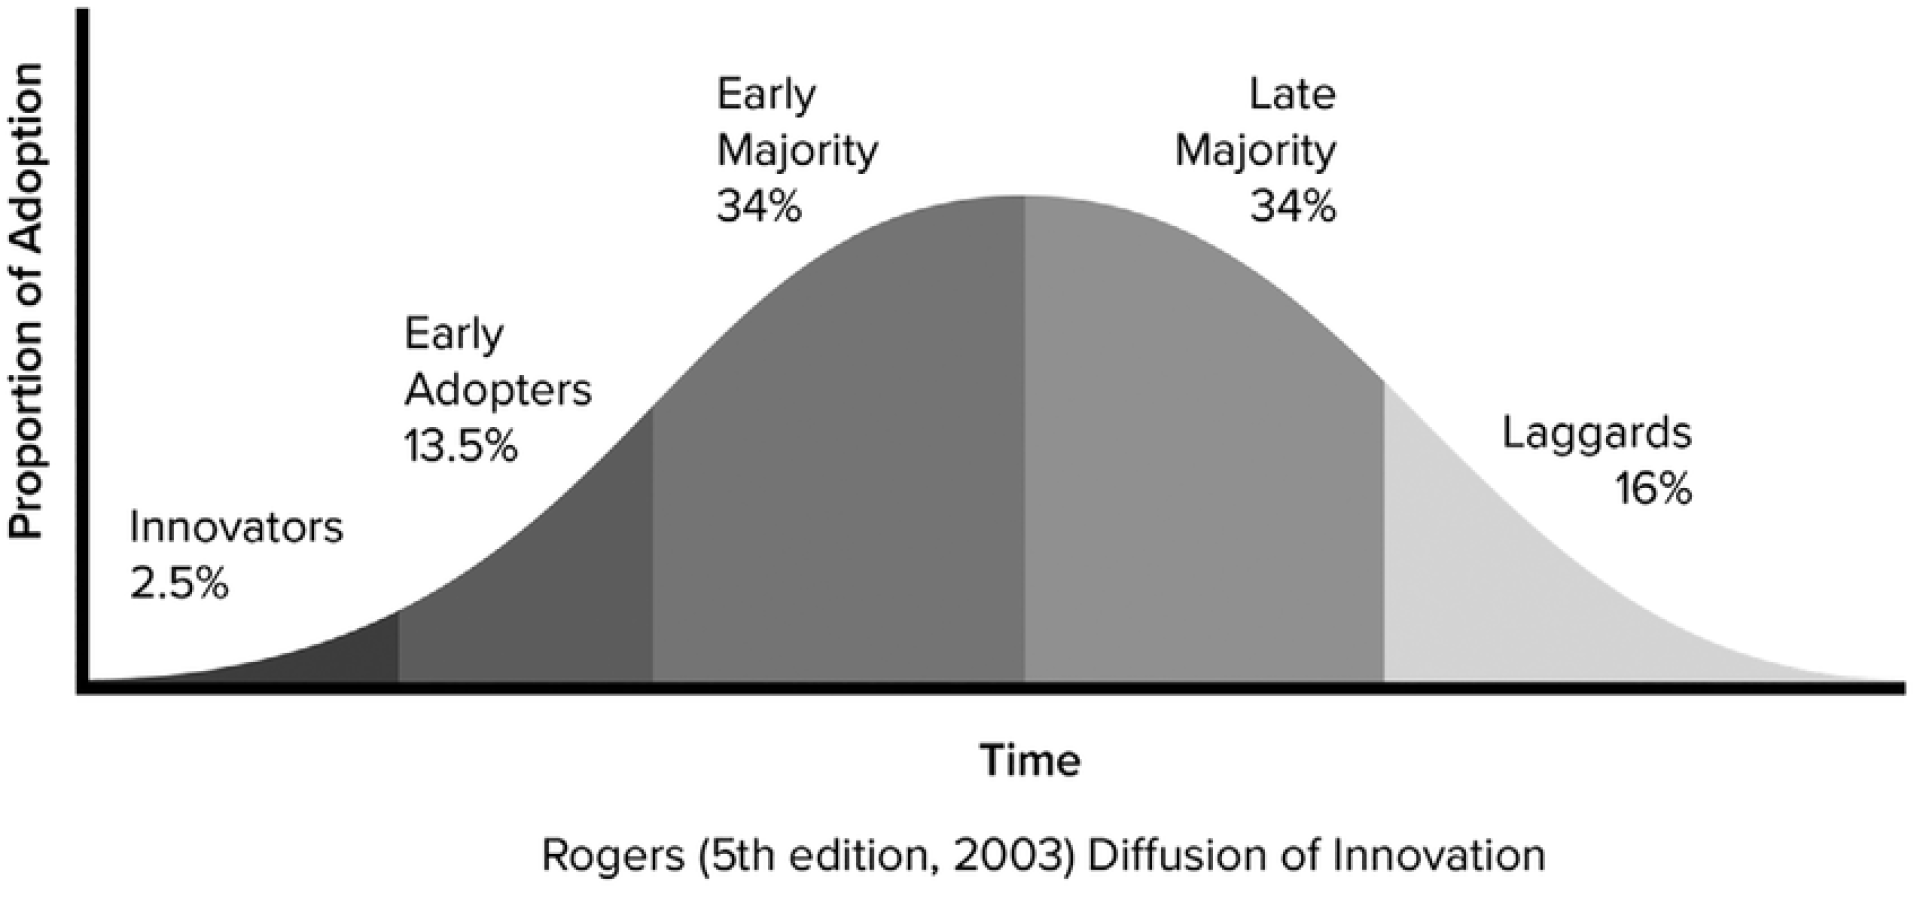
Rogers’ Innovation-Adoption Curve was heavily influenced by fundamental Statistical theory. Physically speaking, the curve strongly resembles a "Standard Distribution" (also known as the "Bell Curve" or a "Normal Distribution"). Moreover, just like the Statistical Model that inspired it, the Rogers model is also centered on the statistical Mean (also known as the "Average") that serves to divide the shape (and population under consideration) into two equal halves.
In a slight departure from the standard Statistical Model, The Rogers model features three groups (Innovators, Early Adopters, Early Majority) to the left of the center, but only two groups (Late Majority, Laggards) to the right of center - even though they represent the same amount of people. Percentages representing the different categories' contribution to the total population are noted, and they add up to 100%. The powerful idea that fewer and fewer people fall further and further away from the average case is depicted pictorially.
Some very powerful ideas are embedded in this model: (A) Regardless of how any specific individual in a population may embrace an innovation, 50% of them are "ahead of the curve"; similarly (B) 50% of individuals are "behind the curve"; and, finally, (C) "The curve" is actually the average, represented by the vertical line at the exact center of the model.
A recent Medium article entitled "The Rogers Adoption Curve & How You Spread New Ideas Throughout Culture" by John-Pierre Maeli (2016) explores the history and context in which the model was originally developed, and provides in-depth definitions for each of the above categories. The article also discusses the power of applying Rogers' work to the present day and why that activity remains valuable and relevant. It outlines recent efforts to re-interpret and re-package the model in order to make it more accessible, especially to a non-technical audience. Finally, it explains the risks involved if people don't appreciate and integrate its implications, and correspondingly adjust their approach to reality. The article is well-written. I enjoyed it and I encourage others to read it too.
The "Law of Large Numbers" Model
Another concept that Rogers leveraged while creating his Innovation-Adoption Curve was a mathematical concept called the Law of Large Numbers, which in some ways might be considered to be an essence of the discipline of Statistics. It goes like this: With a sufficient number of samples, the true nature of things are increasingly revealed, become more likely to be predicted, and sometimes display revelatory intuitive and counter-intuitive patterns. While constructing the Innovation-Adoption Curve, what Rogers was attempting to capture the Statistical truism that while everyone is perfectly free to express their individual preferences when it comes to how they might individually embrace a particular innovation, patterns are highly likely to emerge if a large enough group of people are observed and appropriate theory, models and tools are applied.
Can These Models Be Applied to the Real World?
Statistical theory is fantastic as far as theory goes - but theory often gets you nothing if it cannot be applied at street level. To be truly transformational (which to me means “having an impact on real people in the real world”) theoretical models need to graduate from academia and become useful tools in the hands of regular people in everyday life. At the very least, such models need to mature from abstraction into something capable of accurately explaining history. Models become a lot more useful (and valuable) if they can be used to estimate or measure things that are happening right now or in the very recent past. To achieve maximum value and impact, models need to enable as many people as possible with the ability to make high-quality, accurate predictions about the future. Predictions that drive decisions and actions that result in a tangible, positive impact on people's lives.
Luckily for us, we might just be in that position. We already have some interesting and useful data. We have contextualized that data by way of a small number of extremely powerful models and ideas. We are starting to explain the past and make observations about an idealized present - but those observations are currently faulty. What we need is more information and additional models to help us more accurately model the past and present. Moving beyond the present, armed with suitable new information and models - we may even be able to venture a prediction regarding the future of Drupal; one that might lead to actionable insights, decisions and actions on the part of Drupal that may lead it to a brighter, better future, or the “silver lining” alluded to in the title of this article.
The next piece in this series introduces additional information and a model drawn from psychology in order to propose a set of models that attempt to create a coherent historical narrative as to how Drupal came to be this way, more accurately reflect why Drupal installations are this way today, and propose an interpretation of the data that uncovers a bright future, or “silver lining” for the Drupal Project as an innovation-oriented enterprise in terms of its strategic direction.
In 2002, Professor Graham Leach began lecturing at Hong Kong Polytechnic University, the largest school in Hong Kong, by teaching graduate level courses in the Department of Computer Science of the School of Engineering. In 2010, he moved over to the School of Design and remained there until his retirement in 2023. Graham currently occupies a Professorship of Entrepreneurship in the School of Business of the newest Tertiary institution in Hong Kong, Gratia Christian College.
 Professor Graham LeachInnovation Commercialization Specialist
Image Attribution Disclaimer: At The Drop Times (TDT), we are committed to properly crediting photographers whose images appear in our content. Many of the images we use come from event organizers, interviewees, or publicly shared galleries under CC BY-SA licenses. However, some images may come from personal collections where metadata is lost, making proper attribution challenging.
Our purpose in using these images is to highlight Drupal, its events, and its contributors—not for commercial gain. If you recognize an image on our platform that is uncredited or incorrectly attributed, we encourage you to reach out to us at #thedroptimes channel on Drupal Slack.
We value the work of visual storytellers and appreciate your help in ensuring fair attribution. Thank you for supporting open-source collaboration!

ASK: Drupal Community Needs Your Support
View all →
Note: The vision of this web portal is to help promote news and stories around the Drupal community and promote and celebrate the people and organizations in the community. We strive to create and distribute our content based on these content policy. If you see any omission/variation on this please reach out to us at #thedroptimes channel on Drupal Slack and we will try to address the issue as best we can.

Related People


You may also like