Revision Graph Module Gets Major Upgrade


Drupal developer Shibin Das has announced the release of an updated version of the Revision Graph module. The latest update made possible with support from digital agency Factorial, enhances Drupal’s content revision system by offering an interactive, visual representation of how content changes over time. It is designed to support editors, site administrators, and content teams working in complex or collaborative environments.
The latest version introduces improvements in usability, performance, and accessibility. It allows users to quickly understand the structure of content revisions, identify branching, and trace changes across different contributors or languages.
What Does Revision Graph Do?
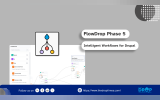
Revision Graph replaces Drupal’s default revision list with a dynamic graph that visualizes each change made to a piece of content. Key features include:
- An interactive timeline of revisions
- Branch and merge visualization
- Clickable nodes showing author, date, and commit messages
- Horizontal date markers for context
- Full support for keyboard navigation and screen readers
This tool is especially valuable for managing multilingual content and tracking the evolution of complex pages with multiple contributors.
How to Use It
To install, developers can run 'composer require drupal/revision_graph' followed by 'drush en revision_graph'. The module works immediately with any content type that has revisions enabled, requiring no configuration.
Where It Shines
Revision Graph is particularly valuable in collaborative and multilingual environments. Editorial teams can visualize who made changes and when, track how translations diverge, and audit content with ease. Its built-in accessibility ensures the tool is usable by all team members, including those using screen readers or keyboard-only navigation—making it powerful and inclusive.
For more details, read Shibin Das' latest blog post on the topic.


ASK: Drupal Community Needs Your Support
View all →
Disclosure: This content is produced with the assistance of AI.
Note: The vision of this web portal is to help promote news and stories around the Drupal community and promote and celebrate the people and organizations in the community. We strive to create and distribute our content based on these content policy. If you see any omission/variation on this please reach out to us at #thedroptimes channel on Drupal Slack and we will try to address the issue as best we can.

Related Organizations
Related People


You may also like