



Xdebug in DDEV: Understanding Step Debugging and Built-In Diagnostics

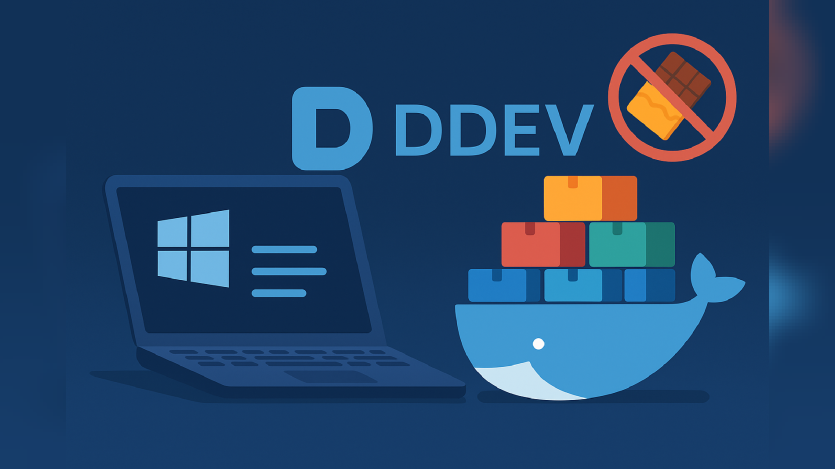
Xdebug step debugging in DDEV usually works with minimal setup — enable it, start the IDE listener, set a breakpoint, and go. When it doesn’t, however, confusion often stems not from PHP itself but from misunderstandings about how containers, networking, and IDE listeners communicate. In a detailed guide, Randy Fay explains how the pieces fit together and how to troubleshoot failures systematically.
Fay outlines the key architectural concept that underpins everything: Xdebug uses a reverse connection model, meaning the IDE must listen on port 9003 while PHP inside the container initiates the connection. DDEV bridges this Docker boundary automatically using host.docker.internal, handling platform-specific networking differences behind the scenes. This distinction matters because most debugging problems are not PHP issues; they are connectivity and configuration misunderstandings.
Rather than leaving developers to trial and error, DDEV includes purpose-built diagnostics such as ddev utility xdebug-diagnose and its interactive mode. These tools verify port listener status, hostname resolution, firewall interference, path mappings, and whether Xdebug is properly loaded — then provide actionable recommendations. By shifting debugging from guesswork to guided troubleshooting, the approach reinforces DDEV’s philosophy of reducing environmental friction so developers can focus on writing code.
The broader lesson is practical: containerised development environments introduce networking layers that can obscure what is happening under the hood. When tools make those layers visible and diagnosable, step debugging becomes predictable rather than mysterious. Fay’s post reframes Xdebug not as a fragile add-on, but as a reliable workflow when its connection model and environment are clearly understood.

ASK: Drupal Community Needs Your Support
View all →
Disclosure: This content is produced with the assistance of AI.
Disclaimer: The opinions expressed in this story do not necessarily represent that of TheDropTimes. We regularly share third-party blog posts that feature Drupal in good faith. TDT recommends Reader's discretion while consuming such content, as the veracity/authenticity of the story depends on the blogger and their motives.
Note: The vision of this web portal is to help promote news and stories around the Drupal community and promote and celebrate the people and organizations in the community. We strive to create and distribute our content based on these content policy. If you see any omission/variation on this please reach out to us at #thedroptimes channel on Drupal Slack and we will try to address the issue as best we can.

Related Organizations

Related People


You may also like