



Native Observability 2.0.0 Measures Its Own Performance Cost

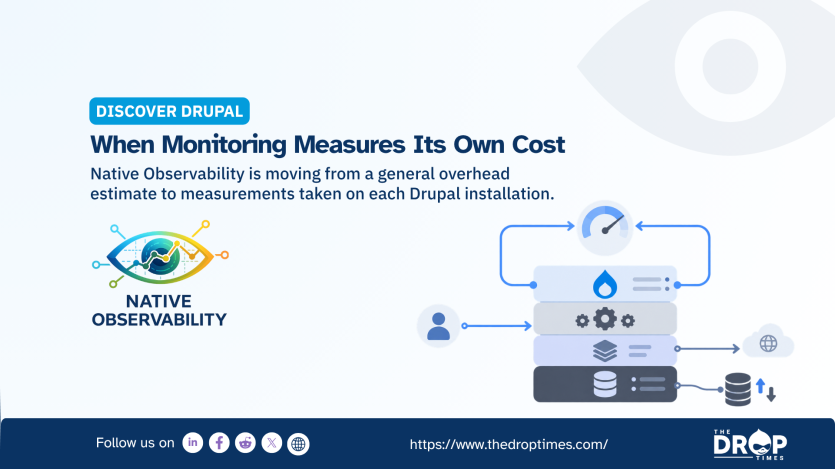
Site administrators can now measure how much extra processing Native Observability adds while it monitors a Drupal installation. Native Observability is a Drupal diagnostic module that records what the application is doing while it serves pages, handles API traffic and runs background work, so developers can investigate where time is being spent. Its 2.0.0 release replaces an earlier estimate of about 10% overhead with a workflow that measures the tracing cost on the Drupal installation where the module actually runs. In a written response to The DropTimes, maintainer Giorgio Alfredo Pagano described the earlier percentage as an overestimate based on his own testing that could not be applied reliably across different servers.
In this context, observability means collecting enough information from a running application to understand what it is doing internally, especially when something is slow or behaving unexpectedly. Tracing is one way of doing that: the software records the sequence of work performed while handling a request or background process. Overhead is the extra processing time and other resources consumed by collecting that diagnostic information. Native Observability therefore has to measure not only Drupal's behaviour, but also the cost of observing it.
Running entirely inside Drupal, Native Observability records request traces, execution spans, database activity, cache behaviour and outbound HTTP calls, with a dashboard for investigating the collected data and optional exports to external observability systems. A request trace follows the work associated with a particular request, while spans represent smaller units of work within that trace so developers can see where time was spent. Database activity shows how Drupal is reading or writing stored data, cache behaviour shows whether previously prepared results are being reused or rebuilt, and outbound HTTP calls show when Drupal contacts another service over the network. Taken together, those records provide a more detailed picture than a single page-load or response-time number.
One reason for building the module was that generic application performance monitoring can show PHP and HTTP activity without necessarily exposing Drupal concepts such as routes, cache tags and render arrays, according to Giorgio's written response. A route describes which part of Drupal handles a particular URL or request, cache tags help Drupal decide when cached information has become outdated, and render arrays are structured instructions Drupal uses when building output for a page. An external monitoring system may show that some PHP code or network request took a long time without showing how those operations relate to those Drupal-specific structures. Native Observability records the activity from inside Drupal, where those relationships are visible.
A second reason was practical. Giorgio described working on a Drupal platform used as an API gateway where installing an external monitoring agent was not possible. An API gateway sits between clients and other services, receiving requests and passing information between systems, while an external monitoring agent is additional software installed on or alongside the server to observe application behaviour. In environments where such an agent cannot be installed, developers may otherwise be left relying mainly on logs and individual application symptoms.
The module is not intended as a competitor to Webprofiler, Giorgio wrote. He described Native Observability instead as a diagnostic tool for collecting Drupal-specific runtime evidence where other options may be limited. The distinction matters because the module is intended to help investigate what Drupal is doing over time, including activity outside an ordinary page request, rather than simply provide a developer toolbar or a single performance snapshot.
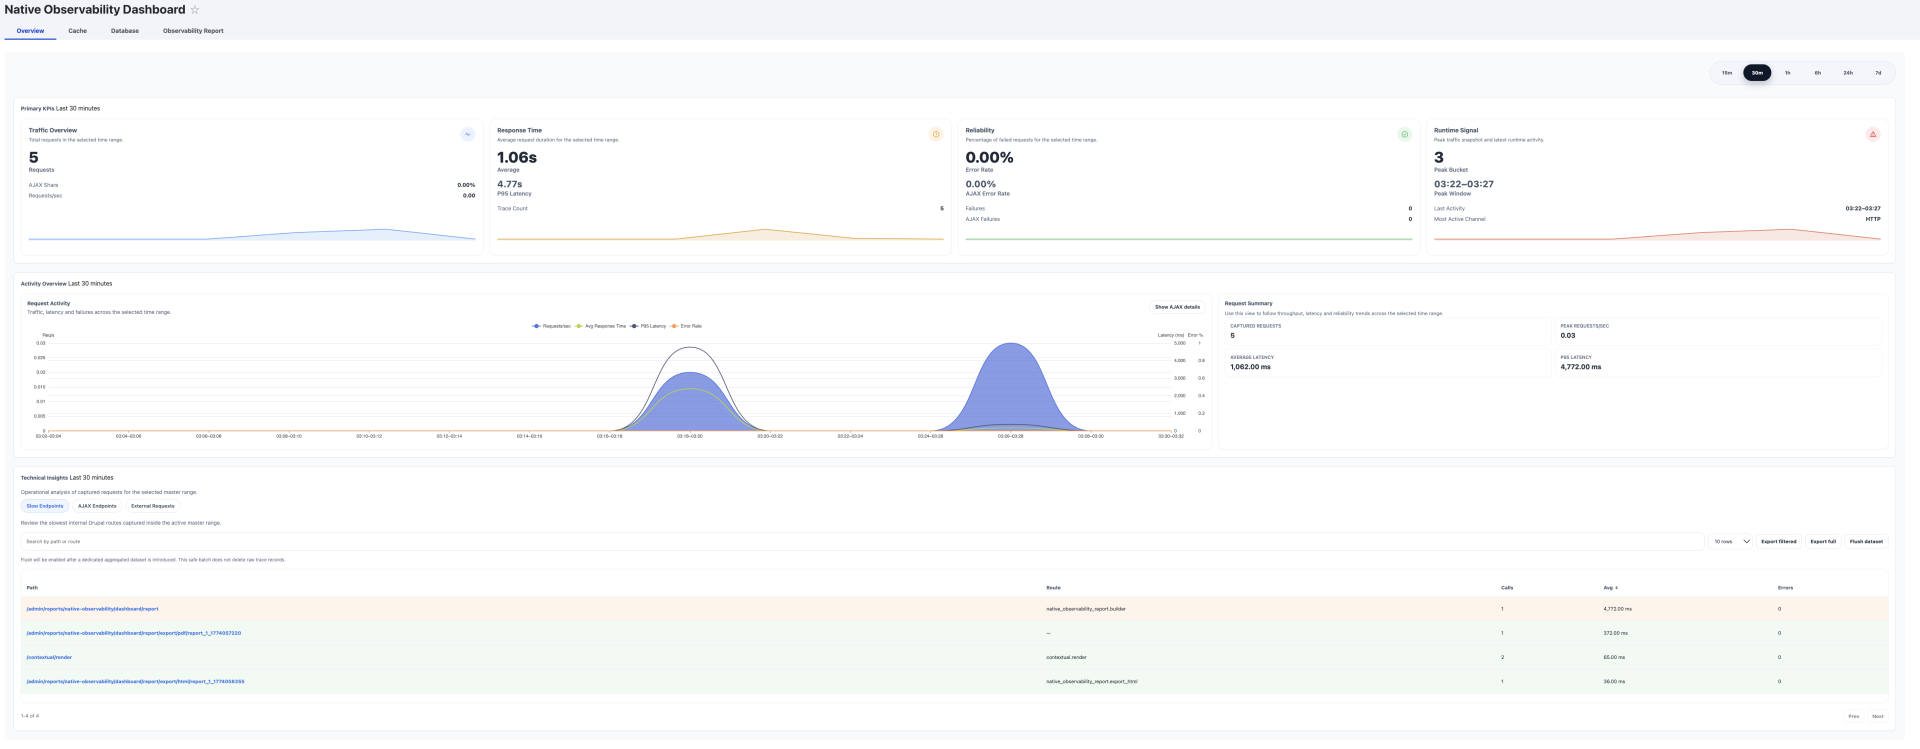
Work on the API gateway provided an example of the kind of problem that combined view can expose. Mobile applications using the platform were receiving stale data from an aggregation process running in cron, while the Drupal route, database and logs did not individually show an obvious failure. Cron is Drupal's mechanism for running scheduled background work, so the aggregation could continue independently of a visitor opening a page. The problem was therefore occurring across several parts of the system rather than inside one visibly failing request.
Traces covering both incoming requests and outbound calls revealed that, after about ten requests, upstream endpoints began responding increasingly slowly without returning an error, according to Giorgio. An upstream endpoint is another service Drupal contacts to obtain or send information. Because those services were still returning valid responses, conventional error logs did not necessarily indicate that anything had failed. The issue was delay rather than outright failure.
Those longer responses stretched the cron run until the API was publishing data that was already old. The Drupal route looked normal, the database looked normal and the logs were clean when examined separately. “No single layer showed it,” Giorgio wrote in his response to The DropTimes. The useful evidence came from seeing how the incoming request, Drupal's own processing and the slower outbound calls related to one another.
Extending that visibility beyond ordinary web requests, the 2.0.0 documentation states that spans recorded without a web request remain represented in the dashboard's response-time breakdown. The documentation specifically cites outbound calls made by cron or Drush as cases where no parent web request exists. Drush is Drupal's command-line administration tool, and commands run through it can perform substantial application work without a browser ever requesting a page. Native Observability can therefore keep diagnostic evidence for work that would be invisible to monitoring focused only on normal web traffic.

That behaviour is relevant to the API-gateway case, where the useful evidence sat in work running outside a normal page request. A traditional request-centred view could show what happened when the API was called but miss the background process responsible for preparing the data returned by that API. By retaining spans from work with no parent web request, the module can keep those two parts of the system visible in the same diagnostic environment.
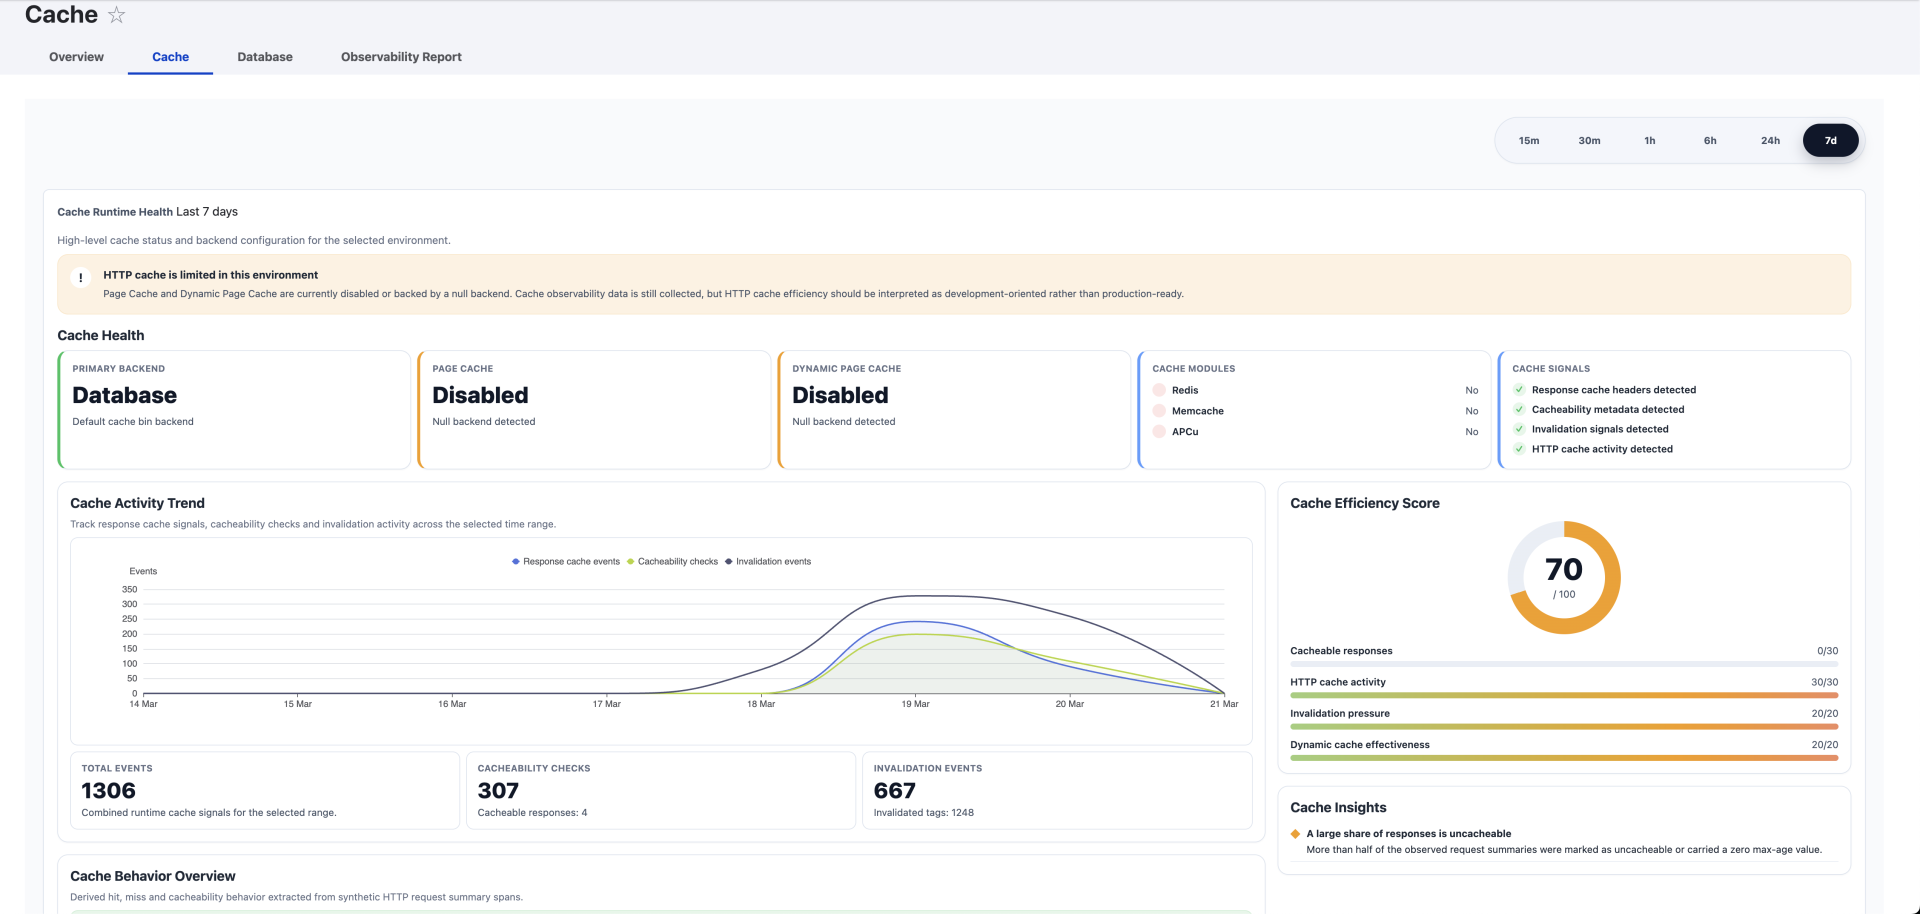
Recording that level of detail creates its own performance cost, which is what led to the reconsideration of the earlier 10% estimate. A monitoring tool must execute additional code, build diagnostic records and eventually save those records somewhere, so observing an application is not computationally free. The important question is how much extra work the module adds on the particular server where it is being used. In his response, Giorgio explained that tests performed on his own machine could not provide a universal percentage for production environments with different hardware and workloads.
Native Observability 2.0.0 instead provides the drush no:overhead:measure command and an administrative measurement interface that compare capture-enabled and capture-disabled states on the same installation. Capture being enabled means the module is actively collecting its detailed observability records; capture being disabled provides a comparison in which that collection work is not being performed. Measuring both states on the same Drupal installation helps isolate the module's own cost from differences between one server and another. It also gives operators a figure derived from the environment they actually manage rather than from Giorgio's development machine.
The documented protocol interleaves the two states, discards a warm-up pair, uses paired differences and a deterministic sign test, and reports absolute milliseconds before percentages. In simpler terms, the test repeatedly alternates between measurements with capture on and capture off, then compares corresponding runs instead of treating unrelated measurements as equivalent. The warm-up pair is excluded so initial startup effects do not distort the result, while paired differences measure the gap between comparable on-and-off runs. The deterministic sign test is a statistical check used to judge whether the observed direction of those differences is consistent rather than simply the result of ordinary timing variation.
Reporting absolute milliseconds before percentages is another important part of the method. If a module adds the same five milliseconds to two requests, that addition can represent a large percentage of a very fast request and a much smaller percentage of an already slow request. A percentage can therefore make identical added work appear different depending on the underlying page speed. The absolute measurement shows how much extra time was actually recorded before that number is expressed relative to anything else.
Dedicated calibration routes provide a fixed workload so repeated measurements can be compared without changes in a site's theme, content or other modules altering the test itself. A calibration route is essentially a controlled Drupal request created for measurement rather than a normal page whose workload may change for unrelated reasons. Using that fixed target reduces the chance that a different block, database query, piece of content or theme operation will make one run heavier than another. The test is therefore designed to measure the observability machinery rather than whatever happens to be changing elsewhere on the site.
Published measurements also show why the project moved away from one percentage. Across eight repeats on Giorgio's development machine, the documented fixed cost ranged from 4.59 to 5.72 milliseconds per request, with the documentation explicitly warning that those figures do not describe another installation. The spread between those results also illustrates that request timings naturally vary even when the same system is being measured repeatedly. The project therefore presents those numbers as measurements from one environment rather than a promise about production performance elsewhere.
A separate request-level census measured 6.253 milliseconds of module work. Of that amount, 0.379 milliseconds, or 6.1%, occurred during the deferred database flush after the response. The remaining 93.9% was attributed to instrumentation that ran before the response left, including execution tracking, span linking and cache observation. Instrumentation is the extra code that watches what the application is doing and records those observations.
The distinction between work performed before and after the response matters because not every part of the monitoring process affects the visitor in the same way. The deferred database flush is the stage where collected records are written to storage after Drupal has produced the response. In that particular measurement, only a small part of the module's measured work occurred during that later database-writing stage. Most of the measured cost came earlier from tracking execution, connecting spans and observing cache activity while Drupal was still processing the request.
A production test cited by Giorgio provides a separate example of the trade-off. Drupal contributor Martin Joergensen ran the module on a site serving about 100 pages per minute and, according to Giorgio, did not notice a performance drop while tracing was active. The database, however, grew to roughly three or four times its previous size. The observation was not presented as a controlled benchmark, so it cannot establish how another Drupal site will behave under the same conditions.
The test nevertheless illustrates that collecting detailed traces can consume substantial storage even when the site's visible response speed does not appear to change. Storage, rather than CPU, was the main constraint in that particular case, according to Giorgio. CPU cost refers to the processing work required to collect and organise the observations, while storage cost comes from retaining the resulting records in the database. A system can therefore remain responsive while still accumulating diagnostic data quickly.
For that reason, Giorgio recommends using the module in diagnostic windows rather than assuming that full tracing should remain enabled indefinitely. Under that approach, an administrator enables capture when investigating a problem, collects enough evidence, then switches capture off while keeping the stored information available for analysis. The recommendation treats detailed tracing as something that can be activated for a specific investigation rather than as a permanent setting for every site.
Supporting that caution, Native Observability provides configurable row limits, retention windows and capture controls rather than treating trace storage as unbounded. Current configuration documentation sets a default cap of 50,000 rows on each raw storage and enables automatic cleanup, with traces retained for 72 hours and spans for 24 hours by default. A row is an individual database record, while a retention window determines how long stored information is kept before older records become eligible for cleanup. Those controls allow operators to limit how much diagnostic history accumulates while tracing is active.
The master capture.enabled setting can stop new capture without uninstalling the module. In practical terms, an administrator can stop Native Observability from recording new activity while leaving the module and the information already collected in place. Those controls matter because the database grows while detailed tracing is active. They allow the module to be used for a defined investigation period rather than requiring administrators either to leave full tracing running or remove the diagnostic environment completely.
Current measurements also give operators a way to reduce the runtime cost without treating observability as all or nothing. Native Observability is divided into submodules that provide different parts of its functionality, so administrators can remove some capabilities when they do not need them. On the project's development machine, removing the Execution and Spans submodules reduced the measured fixed cost from 4.726 to 1.795 milliseconds per request. In that comparison, those two components accounted for about 62% of the measured total.
Execution and Spans are also foundational components for other parts of the module. The Dashboard, Report and Export submodules depend on them and are removed with them. The lower measured cost therefore comes with a functional trade-off rather than representing a free performance improvement. An operator can reduce the amount of observability work being performed, but doing so also removes features that depend on the discarded data.
Native Observability 2.0.0 therefore replaces a broad claim about overhead with measurements that identify both the cost on a particular server and which parts of the observability stack contribute to it. For a developer, the detailed figures can help determine which instrumentation is responsible for most of the extra work. For a less specialised operator, the practical point is that the module no longer asks every site to accept the same percentage estimate. Each installation can measure its own cost and decide how much diagnostic visibility it needs.
The reporting change also makes the provenance of an overhead figure explicit. Native Observability reports can leave the overhead section hidden, show a value declared manually by the document author, or show a value produced by the module's measurement process, with the source of the number printed alongside it. Provenance here means knowing where a figure came from rather than seeing a percentage without context. A reader of the report can therefore distinguish between an author-supplied number and one generated by the module's measurement workflow.
Questions from The DropTimes prompted Giorgio to re-examine the earlier estimate. Version 2.0.0 turns that investigation into a reproducible mechanism that Drupal operators can run on their own infrastructure. The release keeps the technical detail needed by developers who want to examine exactly where tracing adds work, while replacing the earlier assumption that one performance percentage could describe every server. For operators encountering observability for the first time, the practical change is simpler: the module now provides a way to measure the cost of watching Drupal on the same system being watched.
 Allen JasonAllen without organs
Image Attribution Disclaimer: At The Drop Times (TDT), we are committed to properly crediting photographers whose images appear in our content. Many of the images we use come from event organizers, interviewees, or publicly shared galleries under CC BY-SA licenses. However, some images may come from personal collections where metadata is lost, making proper attribution challenging.
Our purpose in using these images is to highlight Drupal, its events, and its contributors—not for commercial gain. If you recognize an image on our platform that is uncredited or incorrectly attributed, we encourage you to reach out to us at #thedroptimes channel on Drupal Slack.
We value the work of visual storytellers and appreciate your help in ensuring fair attribution. Thank you for supporting open-source collaboration!


ASK: Drupal Community Needs Your Support
View all →
Disclosure: This content is produced with the assistance of AI.
Note: The vision of this web portal is to help promote news and stories around the Drupal community and promote and celebrate the people and organizations in the community. We strive to create and distribute our content based on these content policy. If you see any omission/variation on this please reach out to us at #thedroptimes channel on Drupal Slack and we will try to address the issue as best we can.

Related People


You may also like