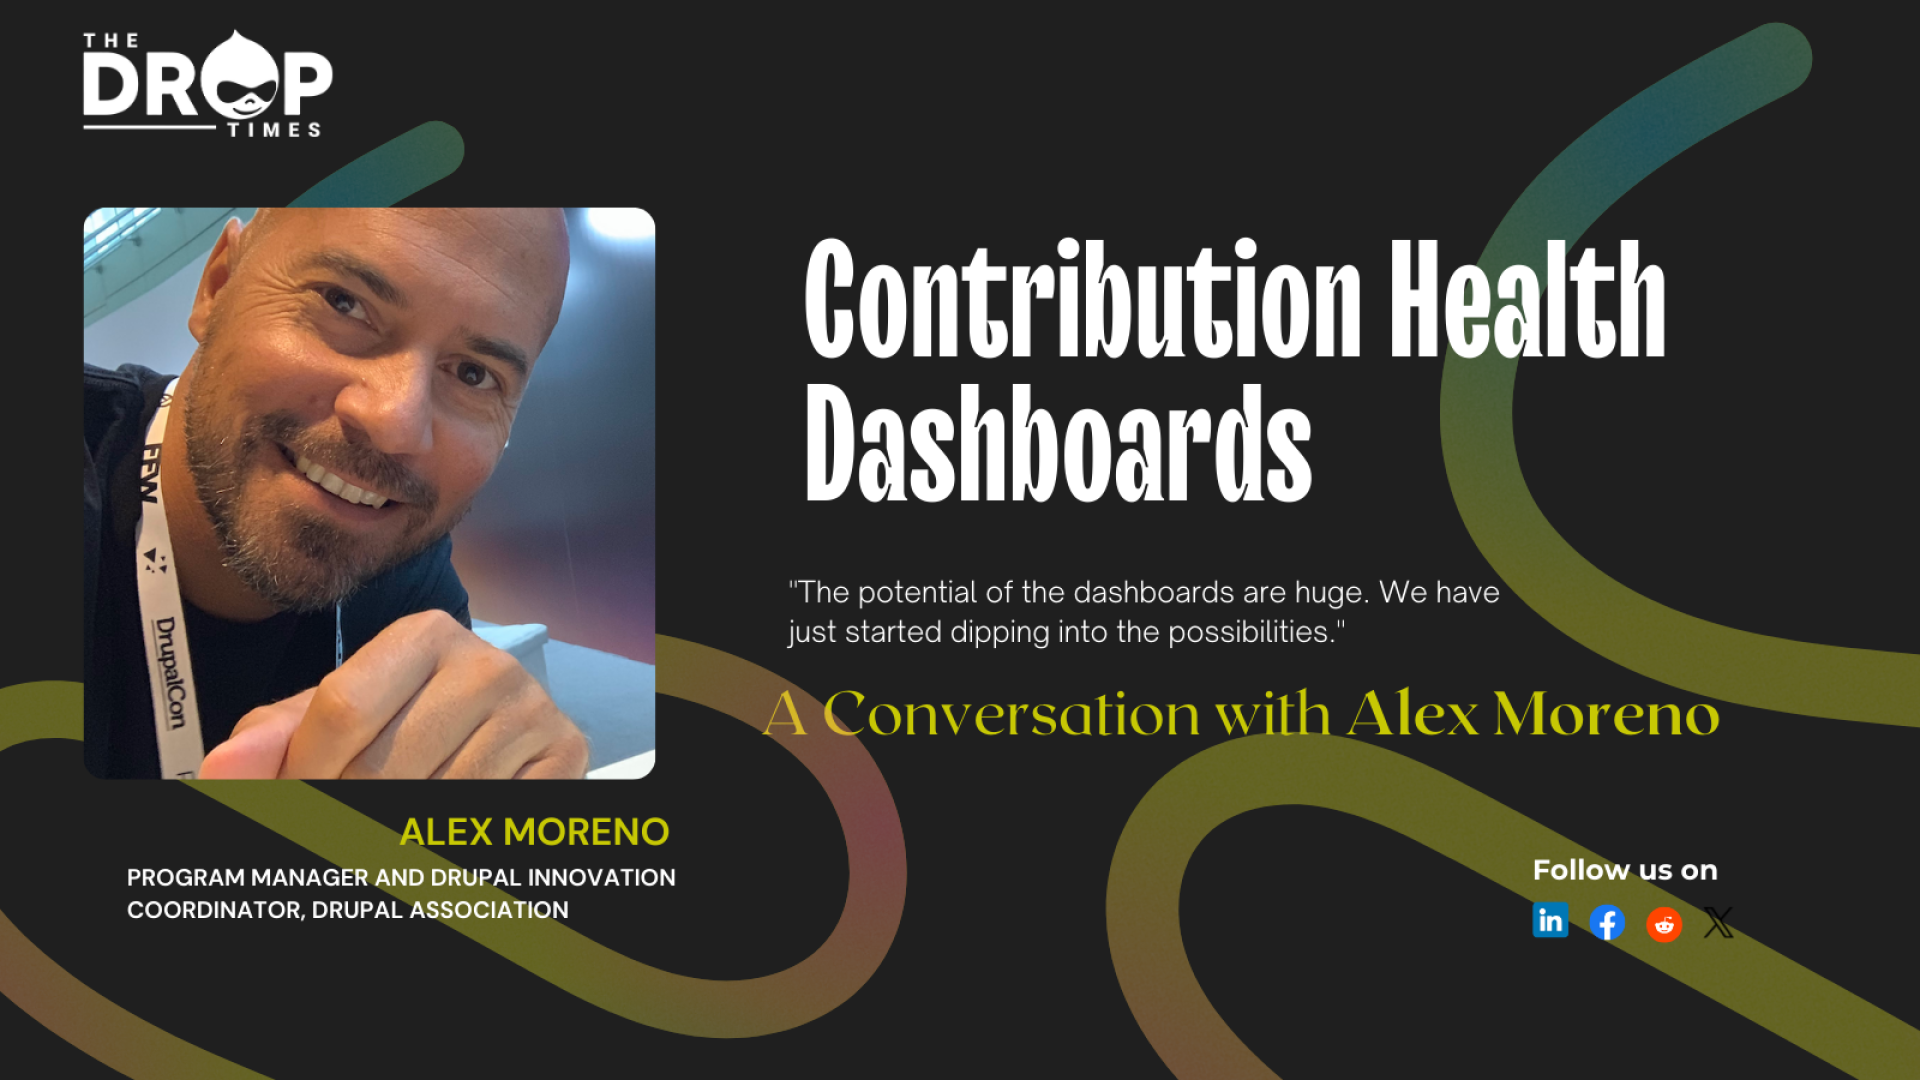
Contribution Health Dashboards: A Conversation with Alex Moreno
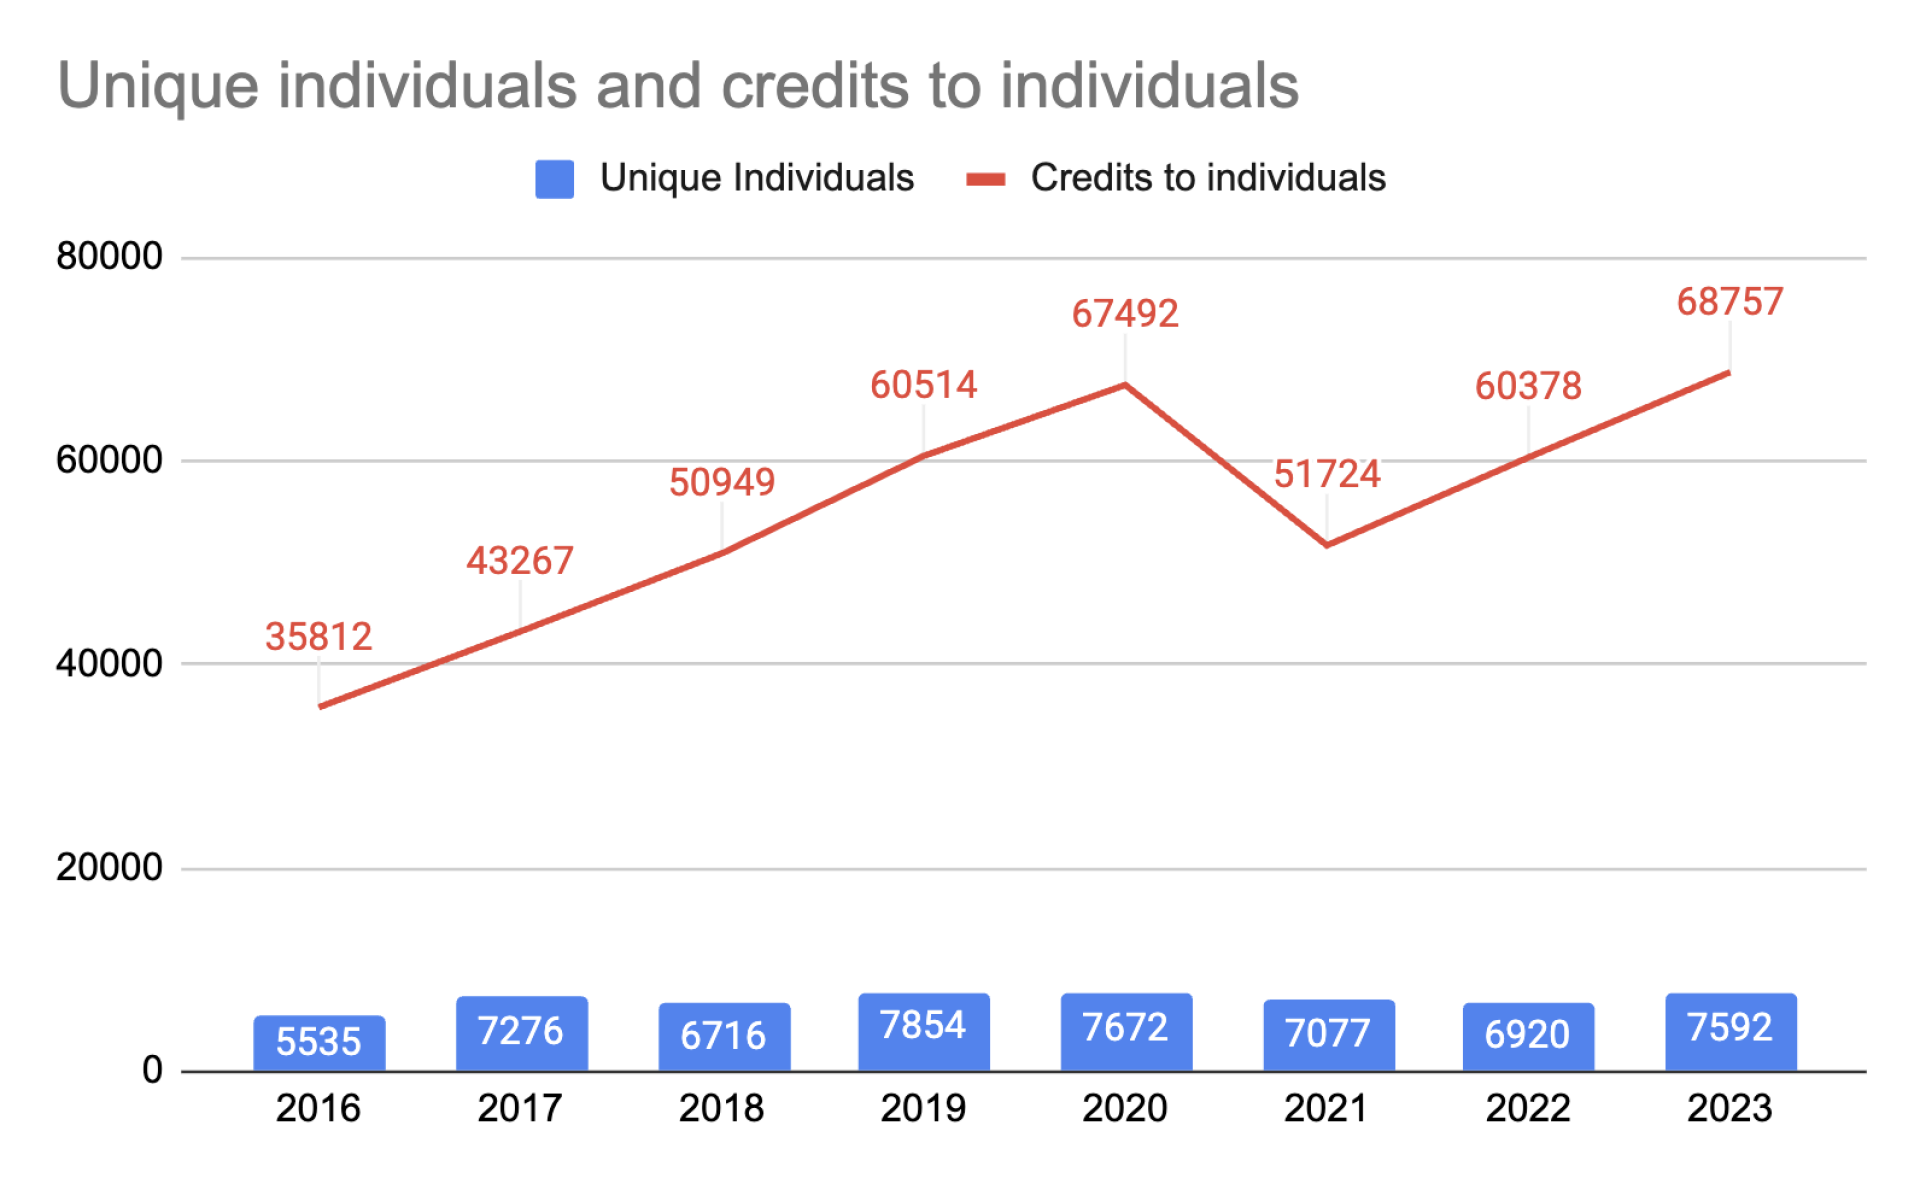
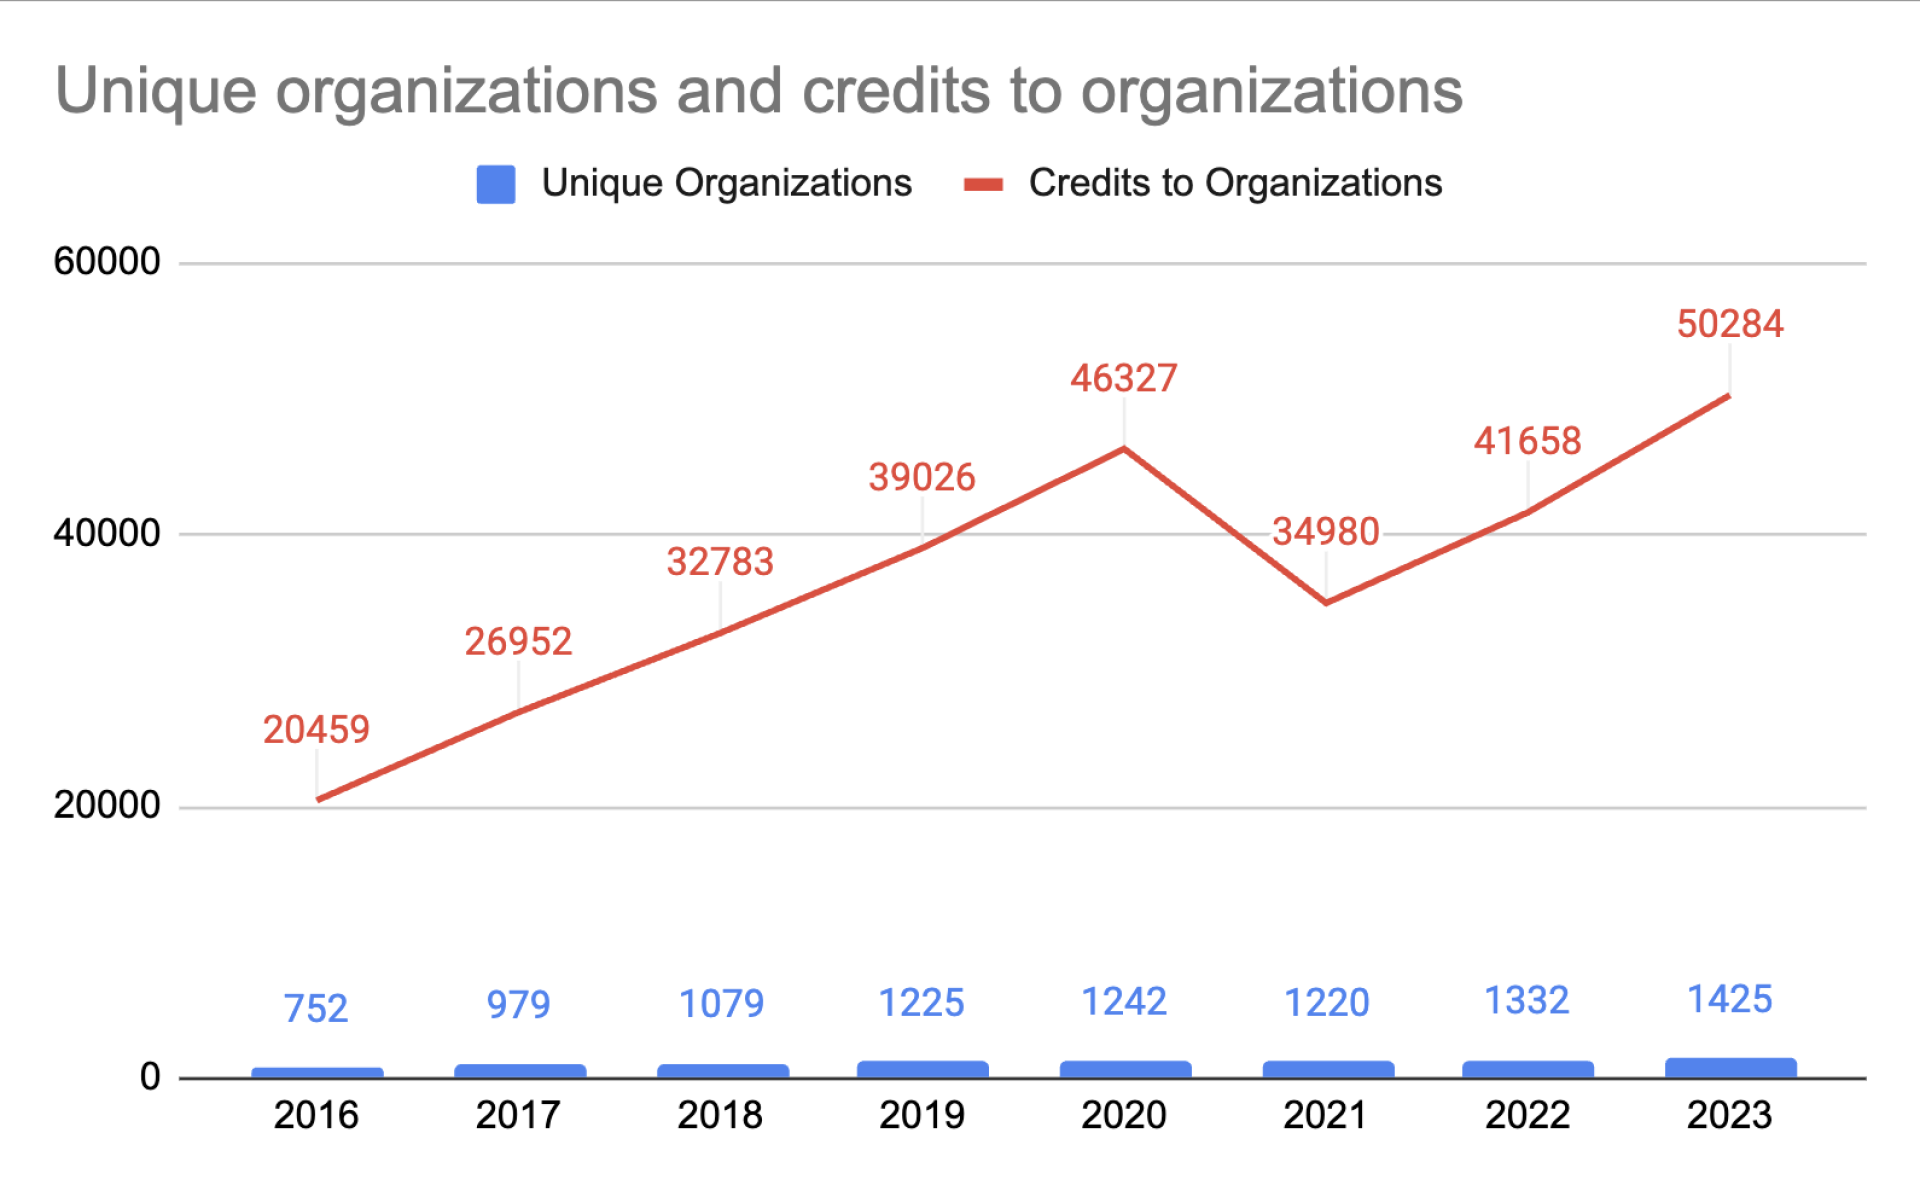
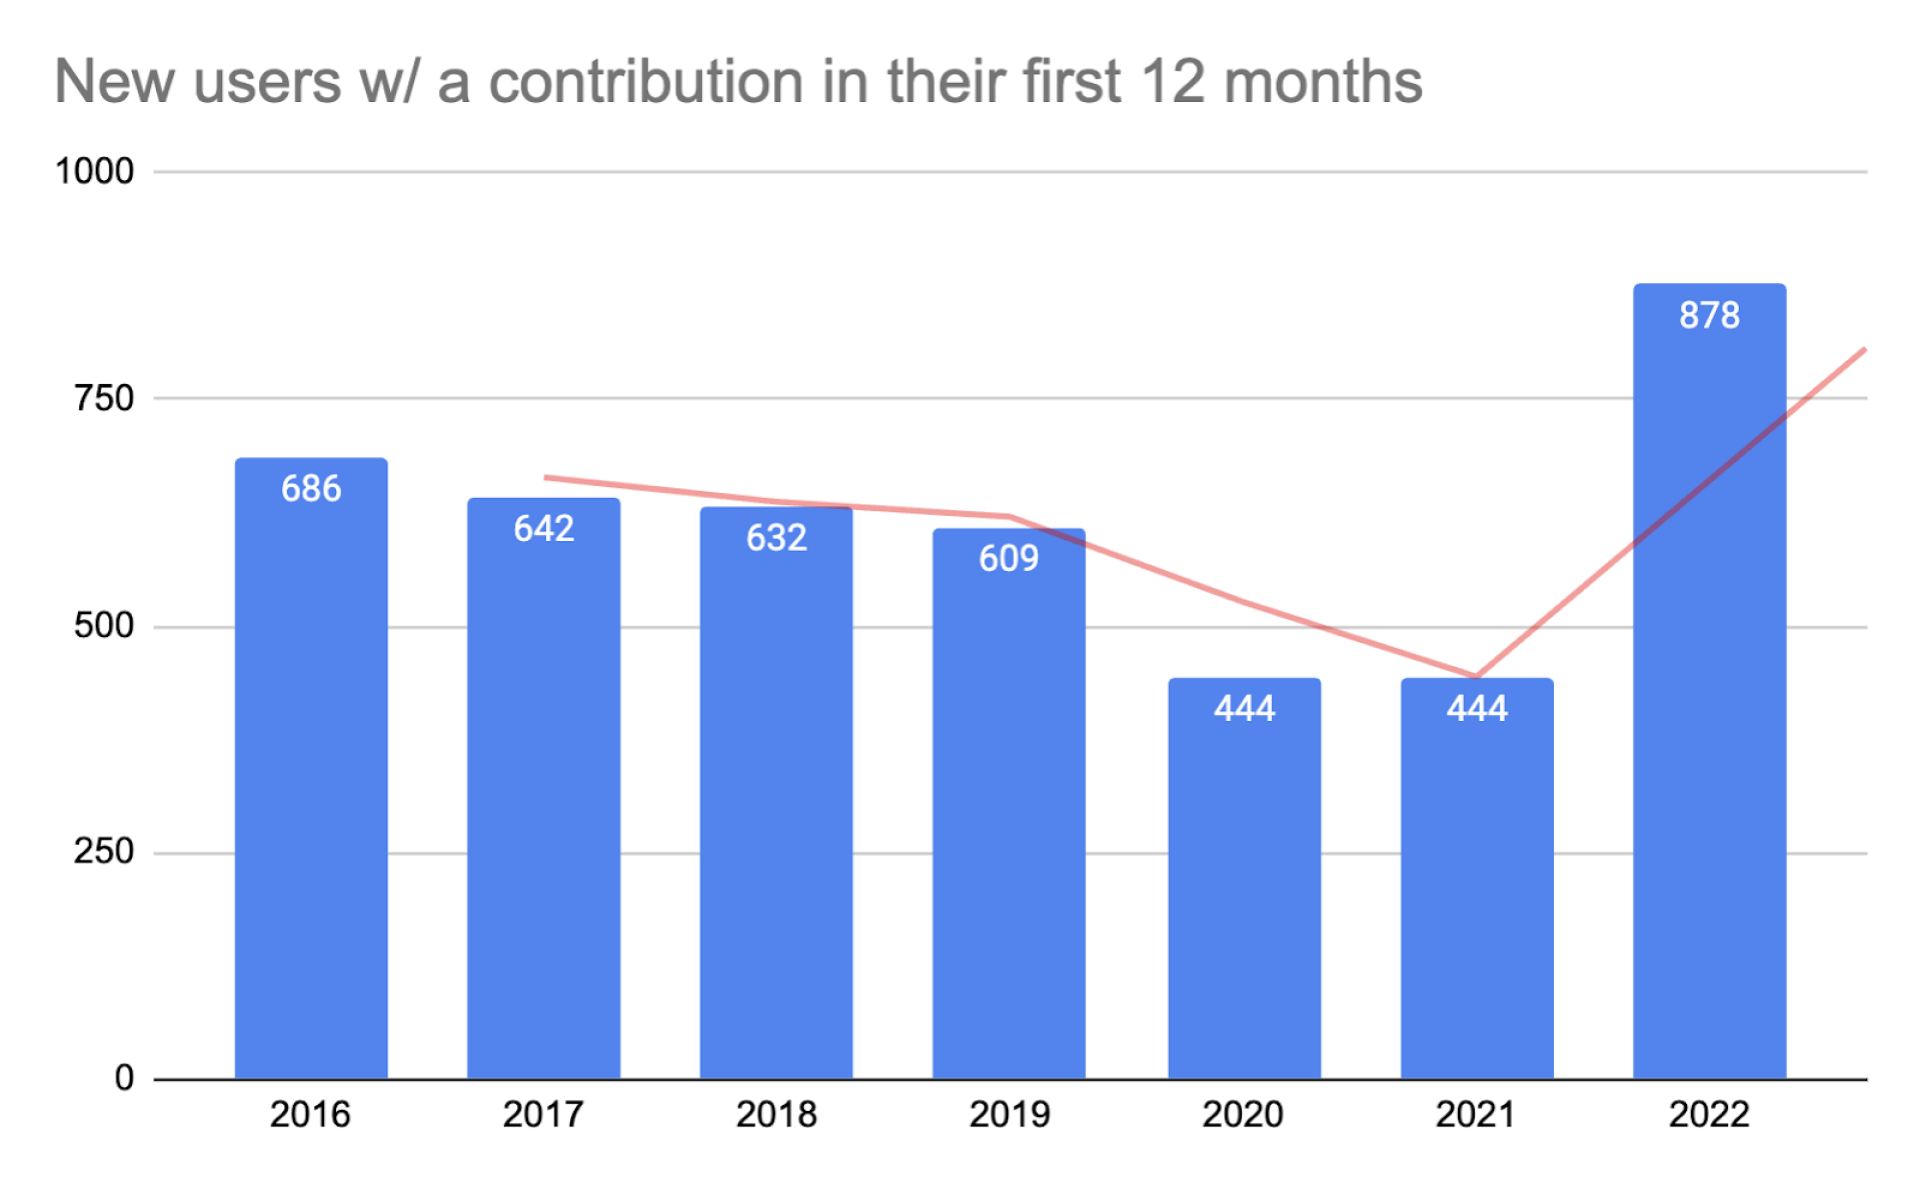
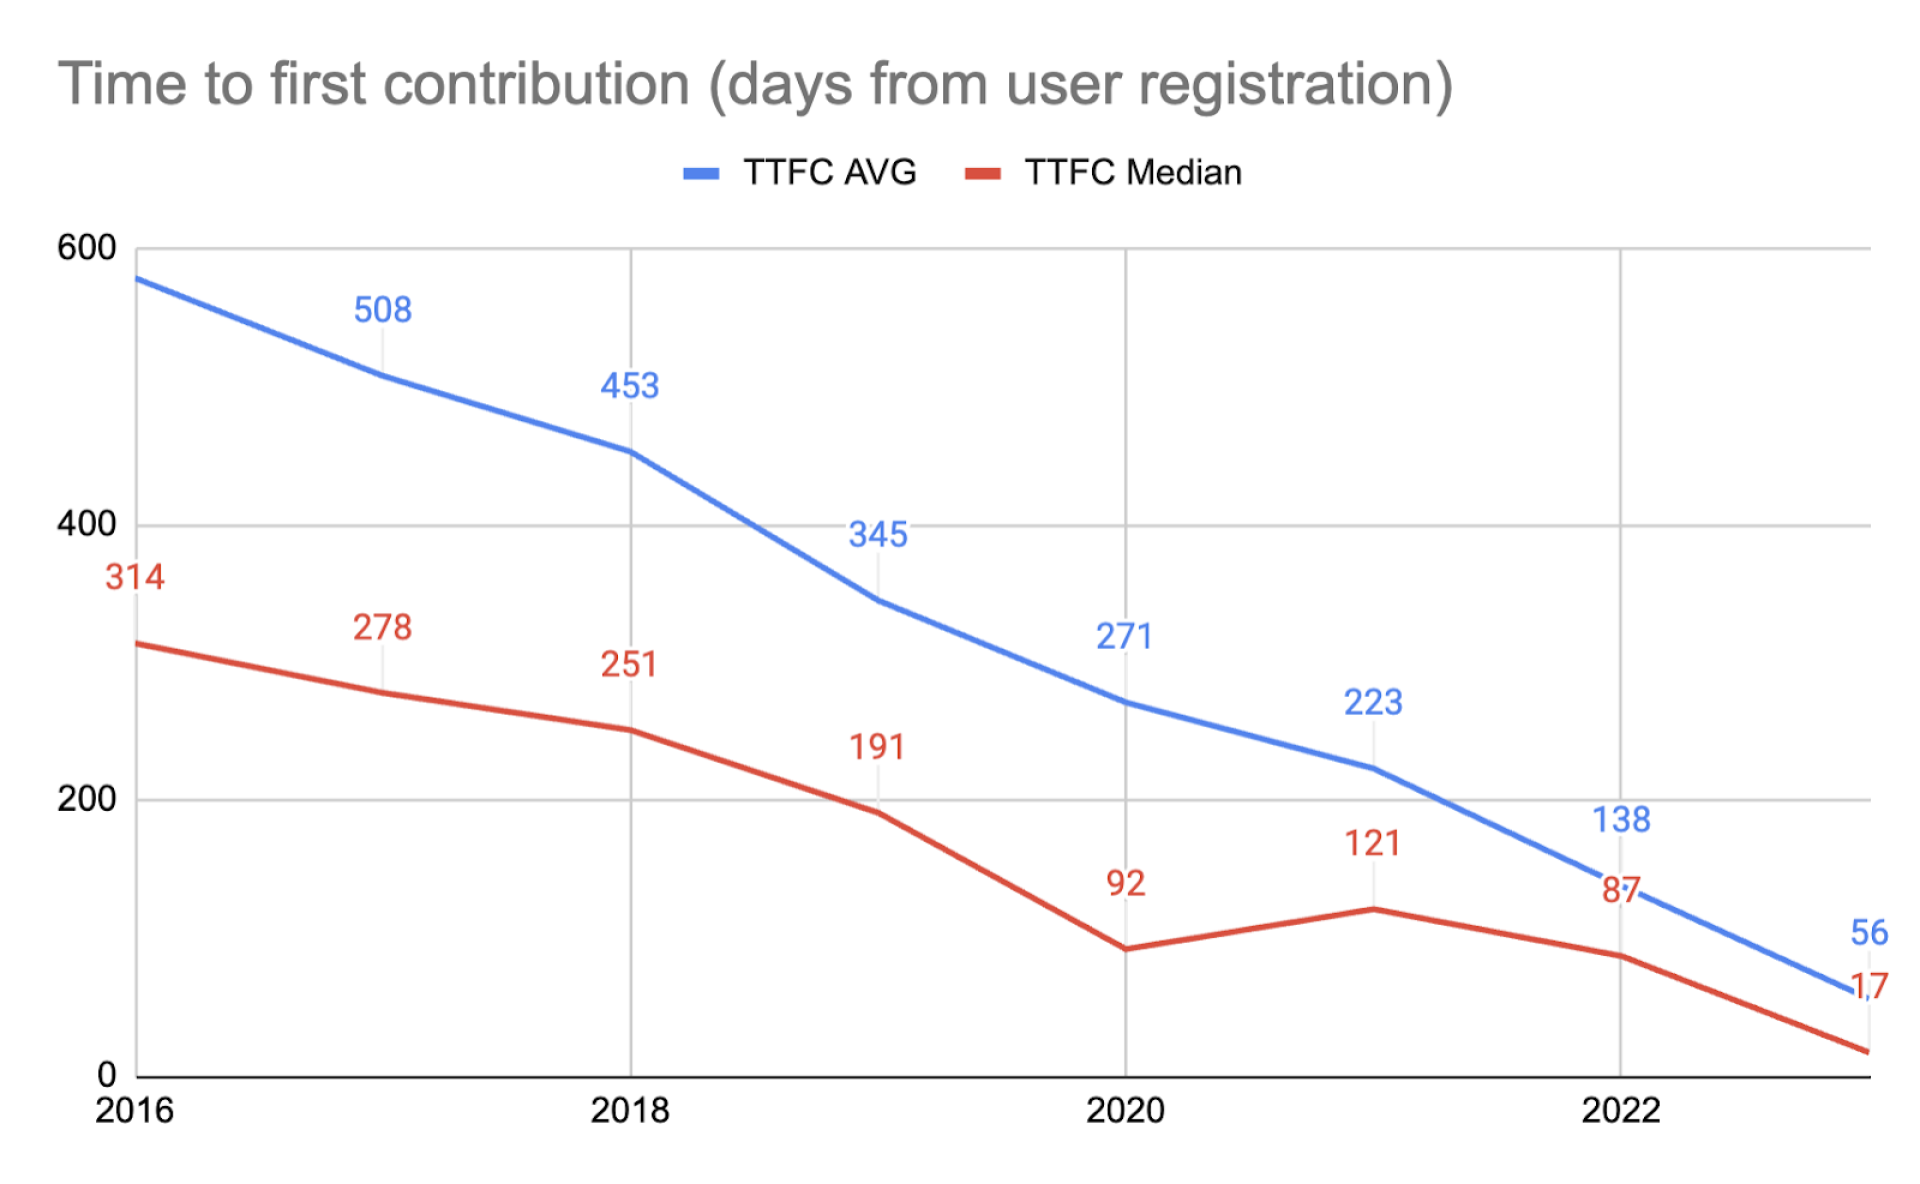
In 2023, the Drupal Association prioritized innovation, aiming to understand and support contributions within the decentralized Drupal community. A key outcome was the development of the Contribution Health Dashboards (CHD) by Alejandro Moreno López (Alex Moreno) to identify barriers to contribution and help investigate and remedy any issues. These dashboards are based on the contribution credit system, providing standardized and measurable contributions to Drupal and incentivizing contributions.
The CH dashboards should help identify what stops or blocks people from contributing, uncover any friction, and if any problems are found, help to investigate and apply adequate remedies while we can as well measure those changes.
Upon request from The DropTimes [TDT], Alex Moreno comprehensively discusses Contribution Health Dashboards with Alka Elizabeth, a sub-editor at TDT.
A boy fascinated by the internet since watching Wargames created his first video game before age 15, treading into multiple aspects of the web world. He now contributes as a Program Manager and Drupal Innovation Coordinator at the Drupal Association.
"When you have an environment with a team that small, and so many things to do around, you learn a lot just by taking risks and simply doing."
says the man who dared into the creation of Contribution Health Dashboards.
The dashboard project originated from the Innovation Working Group and aims to provide a baseline for community progress and understanding of the lack of contribution. These are expected to drive innovation within the Drupal community and foster a sense of inclusivity and collaboration. Regional diversity within the community is also considered, focusing on helping underrepresented regions.
Alex Moreno invites our readers to know more about this latest innovation in the Drupal Community and seeks feedback emphasizing the importance of being challenged in ideas and beliefs.
TDT [1]: Could you give us a brief introduction about yourself? What are your roles and responsibilities within the Drupal Association?
Alex Moreno: I was attracted to technology from a very early age. I think it was the first movie, Wargames when I was first introduced to the concept of the internet and how computers in different parts of the world could communicate with each other. That felt like magic to me since I became increasingly interested in technology.
My first contact with software was with an old Amstrad CPC. It was a very advanced marvel of the time, with 128kb of memory. I wrote my first video game by following a book that came with the computer and taught you to program. I think I was 14 or 15 years old, and everything felt so exciting, new and futuristic.
My passion for technology hasn't faded since, and when I had to decide between being a veterinarian (I love animals) or getting into computers, I decided that computers would be there for the rest of my life. I studied Computer Science, specialising in the last two years of my career in Artificial Intelligence. Artificial Intelligence back then, we were talking 15 years ago, or so you can imagine, was far, far different from what we are watching today happening around us.
When I finished my degree, I got involved in online marketing, building an online presence for companies and building network content as an investment. That went well, and at a point, I had a few dozen publications reaching around a million users monthly. It was also fun, and I learned a lot but was missing something. I did not understand how big projects work, so I made my bags and took a one-way flight to London, where I ended up working in a big consultancy with Capgemini. I worked for big customers like Royal Mail and joined an amazing and talented team at the BBC. One of the most interesting and tougher times was working for Acquia as Professional Services. I got experience in the pharmaceutical industry with companies like Bayer or Novartis; I travel quite a lot. I represented the company in some events, and it allowed me to move to Developer Relations, an industry I’ve been passionate about for some time.
Fast forward to recent history: Pantheon closed their whole developer relations team last year, just 12 months after I joined them. That was also scary and sad, as I loved the people I was working with, and we did some really cool things. It was scary because I had never lost a job before, but it was perfect timing, I guess. Baddy is a great friend, and she called me one day,
“Alex, you have to talk to the Drupal Association, there are some really cool things going on there”.
I had a few opportunities, some more stable in big consultancy, but this felt like a good opportunity to do something for the community, something for the greater good.
One of my tasks here at the Drupal Association has been helping with innovation, understanding how the Association works, getting involved with the engineering and communications teams, and talking to partners in the DrupalCon organization… When you have an environment with a team that small and so many things to do around it, you learn a lot just by taking risks and simply doing. As Tim Lehenen says,
“The Drupal Association is a tiny but mighty team”.
I’ve enjoyed being part of this team a lot.
TDT [2]: How did the idea for the Contribution Health Dashboard come about? Could you briefly discuss this project and its objectives?
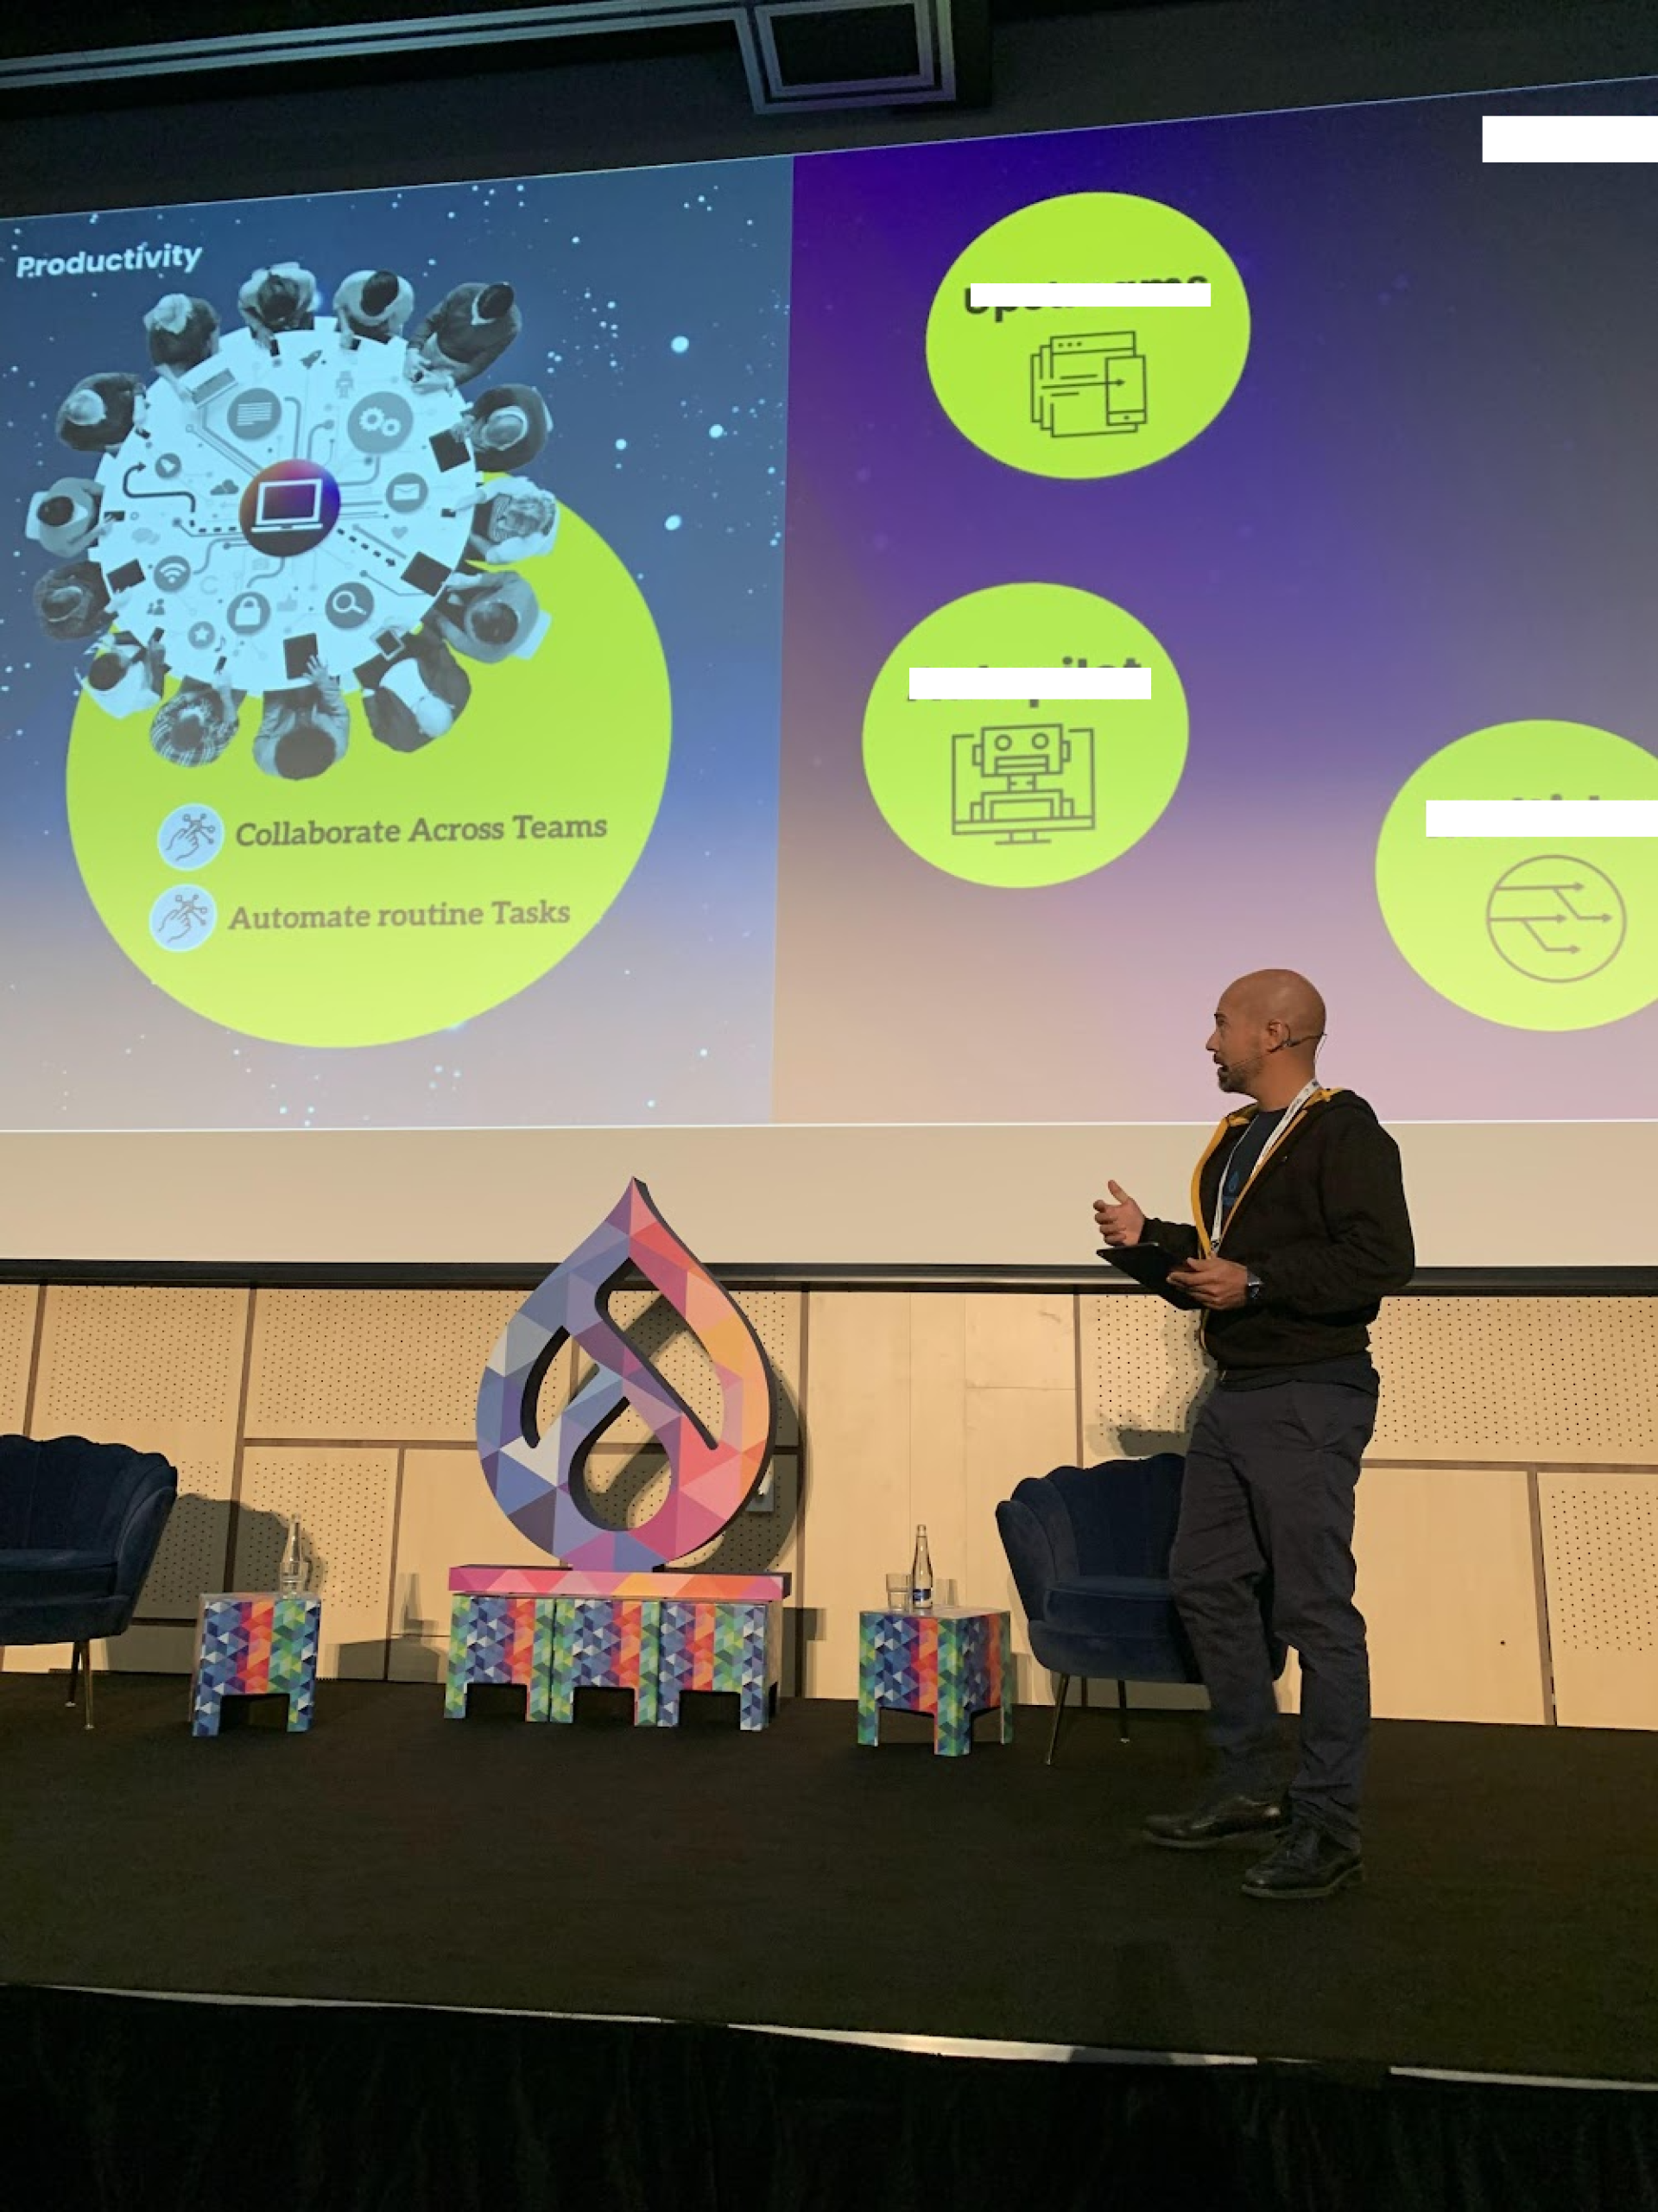
Alex Moreno: There is a working group that we call the Innovation Working Group. I think you can guess its purpose. When I joined the Association, I took the lead in organizing and driving those conversations.
And mind you, full disclaimer: you are asking a technical architect to act as a project manager. It has been a tough challenge for me, but I’m taking a few lessons from it. I’m beyond grateful to Tim Lehnen for his support and guidance, and especially for making me feel that I was part of a team as opposed to someone fighting in the middle of opposing forces, the Board of Directors, the Drupal Association, and the working group itself.
Early on in those discussions, we agreed that to know where we were going, we needed to understand how things were changing and evolving over time. And at that time, a few months back, we didn’t have anything. We were flying blind.
Nick Veenhof, as the Chair of the group, was instrumental in guiding the group, all of us, in the right direction. I am personally grateful to Nick for his contribution to the group and all the catch-ups and one-to-one conversations we’ve had during the last few months. He has been very tough sometimes and very direct with his criticism. But thanks to his tough and direct approach, we are in a better place nowadays than 12 months ago. The dashboards should have his signature at the bottom. Maybe we should do that and add some kind of credits section.
I presented those ideas to the working group to measure things, have a baseline, etc., and everyone, including Dries, was very supportive and excited to have that built. We would have a baseline from which we could measure our progress (or lack thereof) as a community. That was around summer 2023.
TDT [3]: Is the dashboard a dynamic system with continuous updates, or is it something that the Drupal Association plans to publish periodically?
Alex Moreno: As of today, the dashboards get the information from different spreadsheets. Those are generated with a Drush script and need to be executed manually in combination with nohub or any similar Linux trickery that can keep the command alive. That’s because we are querying thousands of users. Some of those queries take several hours to finish. That was a challenge as well during development.
Once those spreadsheets are generated, some work is involved in extracting the information, putting it on graphs, and interpreting the numbers we see.
There have been some discussions to automate the whole process so we can run and update the dashboards monthly or quarterly, but for now, there are other priorities. As they say, “perfect is the enemy of done,” so we don’t want to spend much time and resources just measuring things but also acting on those findings.
That being said, automating this process won’t take a huge amount of effort. It will be just a question of putting things on a script and letting it run with a Linux cron periodically.
TDT [4]: Our readers are eager to learn about the technology behind the dashboard. What background work and technologies were involved in its development?
Alex Moreno: Extracting that data has been a challenge. The data itself lies hidden, deep in Drupal.org's guts. In the beginning, I spent a lot of time understanding the data we needed, where we could find it, and how to extract it.
Although some things are moving to Gitlab, all that data is in Drupal.org today. There is an API that felt like the perfect, safe manner to interact with the website and its data, and the first prototype was started following that concept, building on top of that idea. I realised very quickly, though, that the API had some limitations that would complicate progress very early. For a start, limits on the bandwidth or the speed at which the queries would be returned. If we are talking about a few queries, that’s fine, but given the amount of data (thousands of users), it could mean, at some point, painfully slow progress. Because we would need a lot of flexibility on the data we were extracting, the API would prove very limited in an early stage.
The next step was to crawl the data. I have some experience building crawlers, which was a natural step for me. It is also fun. However, I started to hit issues with the different layers in Drupal.org that are trying to prevent abuse on the website, spamming, and things like that. The other big issue with crawling is that, although it is relatively easy to extract the data, once you have it, you will need to do some validation, cleanup, and post-processing.
Using direct SQL queries was the next logical step. That gives you a huge flexibility in terms of the queries and the data you need to extract. But this has some limitations as well. For example, building a version of Drupal.org locally would prove a challenge for several reasons, like the database size or the fact that we are storing thousands of users, and storing that information in a laptop can be a challenge in some countries. Like the whole of Europe, and US states like California, for a start with the GDPR policy regulation in Europe.
However, the biggest limitation is the fact that some queries can start to get pretty complex, and hence, it would get more and more complicated to maintain a readable, reasonably clean code for the long term.
Ultimately, the dashboards are built on top of Drush scripts, which makes sense given it is a Drupal site. Some of the queries can still be a bit complicated, but they are far more readable, and it will be easy to evolve the concept in the future. Executing “join” queries to build complex requests and spicing things up becomes relatively easy.
Something we are not able to look at at the moment is the status of a given issue or issues over a period of time. Say, I want to see how many issues we had on RTBC in 2019 or 2020. If we look at the issues, the current status tells us where those issues are nowadays. It may be on RTBC or maybe on waiting for review. However, unless that’s a final status, it won’t give us information about where things were 2 or 3 years ago. The information is there. It is just complex to extract it on a mass volume.
I have a few ideas on how to extract it, for example, looking at the different changes across time and storing the status changes linked to the date when they occurred. That should make it possible to sort out and present the data in the way we may need it.
TDT [5]: Has your background in AI contributed to the development of this project? Is there a plan to incorporate machine learning or AI to make the insights from the dashboard more actionable?
Alex Moreno: That’s an interesting question. Although at some point I researched some tools, mostly spreadsheets that could work with high volumes of data, but other ideas and tools as well, no, in the end, nothing fancy was applied here. We needed something very simple: just extract pure data, do some work to validate, ensure the data looked good, and put it on those dashboards.
It is true that, looking forward, some really interesting tools could be used to understand patterns that would be impossible to discover by a human. Those tools are nowadays applied in commerce, for example, to understand behavioural groups. Find patterns of individuals that have a high chance of executing certain actions (i.e. use a discount, buy a specific product, etc.). Do we need that for what we want to achieve here? Not really. But there is some work on understanding better Drupal.org visitors, what they do, and their behaviour… one of the issues we have in our community is trying to attract the younger generations, improve their onboarding, how we connect with them… so maybe in the short term AI could be a great helper understanding how we could improve those areas.
TDT [6]: What are the next steps for the Drupal Association in using these insights? How do you plan to encourage more people to join the Drupal community and contribute back?
Alex Moreno: There is the long tail of open source contribution and the short tail of open source contribution. I don’t know if anyone has used those terms before, but my marketing background inspires them. I plan to expand on those concepts in a couple of posts I have planned in the next 2 or 3 weeks.
In those articles, I will talk about the plans that I would recommend long and short term, but for now, I can tell you that we need to improve several areas. One is how users join our community, how we interact with them, what we tell them. Do we listen to them? If so, how? Are we following up?
How would a company use that data? We need to treat the Drupal Association like a company doing business. We need to consider that we are not about selling stuff, and we need to be respectful to the community and its members. The Drupal Association is different from a company, but in a way, there are things that we can apply here as well.
Why don’t we gamify the user profile? Could we promote contribution by giving incentives to the users? What about badges? First-time contributor badge? Or what about a hero badge for those contributing more than a number of credits in a period of time? Or are those contributing in their first 12 months after registering? Also, some of these things may need to be consulted with the community first.
The good thing about the Dashboards is that we are free to start testing improvements and find exactly what is happening and when. One key principle in marketing is to measure everything. Do some changes, measure, and repeat. That data must back up those iterations. We don’t know how things will move, but once we do it, then we can react quickly. Repeat what was successful and discard what wasn’t.
TDT [7]: How do you anticipate the Contribution Health Dashboards will affect the overall health and growth of the Drupal community? Are there specific areas or metrics that you are particularly focused on improving?
Alex Moreno: What is more and more clear to me after this time working with the Drupal Association is that innovation (which is a key goal for the Association) will not come from a specific role or from a group of individuals, regardless of how smart they may be or how many resources they may have. But if it’s not going to come from specific individuals or groups, from whom then?
And the answer to that question lies exactly in our biggest strength. Our joy and pride! Yes, we may be getting old; we may always be the same people gathering around Drupal Camps and DrupalCons. But that’s exactly what makes us stronger. Our community, our deep sense of responsibility towards our ecosystem of contributed modules, parallel projects, and everything in between. Innovation is going to come from ourselves, not as individuals, but as a community. Our Open Source community must foster and nurture that innovation, facilitating innovation from where we least expect.
How we make the Drupal Association more useful to that community has been key during my research. The Drupal Association needs to act as the glue that puts all those pieces together.
Also, ideas stagnate easily if we don’t bring new blood and new people. We need to be challenged, to be told that we are wrong. And that is going to come mostly from outside our own community.
In that sense, the initiative of cheaper DrupalCon tickets for local students is something we have discussed and advocated for in the past, and it’s great to see Christina Lockhart and the rest of the Drupal Association team come up with the plan.
This year, we also have a special student ticket rate of only $50! This rate applies to all students and recent graduates (2022 onward) of universities, colleges, trade schools, high schools, and Drupal training programs. Students will access job fairs, opportunities to improve resumes, mentors, and invaluable networking opportunities.
You can read the newsletter here.
TDT [8]: In what ways can the Drupal community contribute to the development and enhancement of these dashboards? Is there a process in place for community feedback and collaboration?
Alex Moreno: For now, you can email me directly at [email protected]
If you or anyone has ideas, things you want to discuss, things you think we should do differently, things we can improve, … Again, I think we need to be challenged in our ideas and beliefs. So far, the feedback has been great, and I’ve been pleasantly surprised, even with thank you and appreciation messages over email and social media.
TDT [9]: What were the biggest challenges you faced while developing these dashboards, and what key learnings did you and your team take away from the experience?
Alex Moreno: As I mentioned before, the way data is stored in Drupal.org is difficult to extract. What complicates things further is that what we were looking for was not always clear.
First, deciding what we were looking for and second, extracting that data were challenges big enough to keep us busy.
TDT [10]: How do these dashboards account for the global diversity of the Drupal community? Are there specific features or data points that help in understanding regional differences in contribution patterns?
Alex Moreno: The potential of the dashboards is huge. We have just started dipping into the possibilities, but so much can be done and analyzed. The next steps could be to measure where the contributions are coming from and understand if we can help other regions feel more welcome between us. For example, African communities. I think a lot of work can be done there, where we can help people and make a difference.
TDT [11]: Drupal is unique in its system and process for acknowledging contributions from individuals and companies, a feature not commonly seen in other Free and Open Source Projects. What advice would you give to other Free and Open Source communities looking to implement similar systems to enhance their contribution ecosystems?
We have built a great culture in Drupal of caring for each other, ensuring we respect everyone, and so on. We embrace differences.
I have seen other communities being much less friendly and even reaching the point of aggressive attitudes towards people contributing or simply being around. You need to promote inclusive attitudes and be open to people making mistakes… in the end, as Michael Jordan said:
"It doesn’t matter if you fall, it’s whether you get back up."
Alex Moreno has written a detailed blog post introducing CHDs on Drupal.org. Find the link here.
Related Event Sessions
Disclaimer: The information provided about the interviewee has been gathered from publicly available resources. The responsibility for the responses shared in the interview solely rests with the featured individual.
Note: The vision of this web portal is to help promote news and stories around the Drupal community and promote and celebrate the people and organizations in the community. We strive to create and distribute our content based on these content policy. If you see any omission/variation on this please let us know in the comments below and we will try to address the issue as best we can.


